Using ServiceMonitor to fetch metrics
Assuming that your application exports metrics on port 8080, the Deployment and Service may look like the following:
apiVersion: apps/v1
kind: Deployment
metadata:
  name: example-app
spec:
  replicas: 3
  selector:
    matchLabels:
      app: example-app
  template:
    metadata:
      labels:
        app: example-app
    spec:
      containers:
        - name: example-app
          image: example-app
          ports:
            - name: web
              containerPort: 8080
---
kind: Service
apiVersion: v1
metadata:
  name: example-app
  labels:
    app: example-app
spec:
  selector:
    app: example-app
  ports:
    - name: web
      port: 8080
Also assuming that the metrics are exposed on the path /metrics, you would have to create a ServiceMonitor that selects the right Service with the correct path:
apiVersion: monitoring.coreos.com/v1
kind: ServiceMonitor
metadata:
  name: example-app
  labels:
    team: frontend
spec:
  selector:
    matchLabels:
      app: example-app
  endpoints:
    - port: web
      path: /metrics
By creating a ServiceMonitor, the Prometheus Operator will automatically updates the Prometheus configuration to add a "scrape_config".
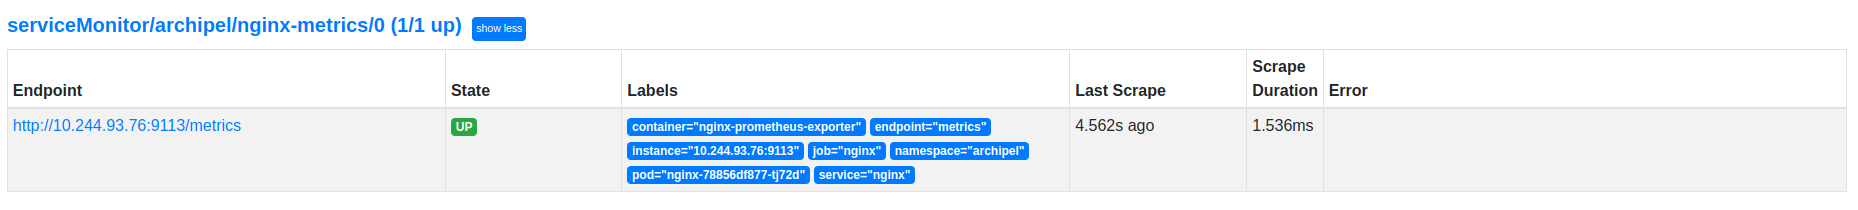
You can see the targets added by the ServiceMonitor on the Prometheus Dashboard.