Deploy the Kube Prometheus Stack
Helm and Docker resources
The Helm resources are stored on the Prometheus Community Git Repository.
The docker images used are:
quay.io/prometheus/alertmanagerquay.io/prometheus-operator/prometheus-operatorquay.io/prometheus/prometheusquay.io/prometheus-operator/prometheus-config-reloader- (
quay.io/thanos/thanos) docker.io/grafana/grafana-oss
Like in the Getting Started, we won't be deploying Thanos and AlertManager.
1. Deploy Namespace and AppProject
kubectl apply -f argo/monitoring/
2. Secrets
Create a SealedSecret which contains the initial credentials for Grafana:
- Create a
-secret.yaml.localfile:
apiVersion: v1
kind: Secret
metadata:
  name: grafana-admin-secret
  namespace: monitoring
stringData:
  admin-password: password
  admin-user: admin
- Seal the secret:
cfctl kubeseal
- Apply the SealedSecret:
kubectl apply -f argo/monitoring/secrets/grafana-admin-sealed-secret.yaml
3. Editing prometheus-app.yaml to use the fork
Replace the repoURL with the url of your fork:
source:
  # You should have forked this repo. Change the URL to your fork.
  repoURL: git@github.com:<your account>/ClusterFactory.git
  # You should use your branch too.
  targetRevision: HEAD
  path: helm-subcharts/kube-prometheus-stack
  helm:
    releaseName: prometheus

    skipCrds: true

    # If the values file is not `values.yaml`:
    # valueFiles:
    #   - values-example.yaml
4. Add the values file to the subchart
Read the values.yaml to see all the default values.
Create a values.yaml inside the helm-subcharts/kube-prometheus-stack directory.
kube-prometheus-stack:
  alertmanager:
    enabled: false

  grafana:
    enabled: true

    image:
      repository: grafana/grafana-oss
      tag: 8.4.5

    persistence:
      type: pvc
      enabled: true
      storageClassName: dynamic-nfs

    securityContext:
      runAsUser: 472
      runAsGroup: 472
      fsGroup: 472

    admin:
      existingSecret: 'grafana-admin-secret'
      userKey: admin-user
      passwordKey: admin-password

    initChownData:
      enabled: false

    ingress:
      enabled: true
      ingressClassName: traefik

      annotations:
        cert-manager.io/cluster-issuer: selfsigned-cluster-issuer
        traefik.ingress.kubernetes.io/router.entrypoints: websecure
        traefik.ingress.kubernetes.io/router.tls: 'true'

      hosts:
        - grafana.example.com

      path: /

      tls:
        - secretName: grafana.example.com-secret
          hosts:
            - grafana.example.com

  ## Component scraping the kube controller manager
  ##
  kubeControllerManager:
    enabled: false

  ## Component scraping coreDns. Use either this or kubeDns
  ##
  coreDns:
    enabled: false

  ## Component scraping kubeDns. Use either this or coreDns
  ##
  kubeDns:
    enabled: false

  ## Component scraping etcd
  ##
  kubeEtcd:
    enabled: false

  ## Component scraping kube scheduler
  ##
  kubeScheduler:
    enabled: false

  ## Component scraping kube proxy
  ##
  kubeProxy:
    enabled: false

  ## Component scraping kube state metrics
  ##
  kubeStateMetrics:
    enabled: true

  ## Configuration for kube-state-metrics subchart
  ##
  kube-state-metrics:
    prometheus:
      monitor:
        enabled: true

  ## Deploy node exporter as a daemonset to all nodes
  ##
  nodeExporter:
    enabled: true

  ## Configuration for prometheus-node-exporter subchart
  ##
  prometheus-node-exporter:
    prometheus:
      monitor:
        enabled: true

  ## Manages Prometheus and Alertmanager components
  ##
  prometheusOperator:
    enabled: true

  ## Deploy a Prometheus instance
  ##
  prometheus:
    enabled: true

    ingress:
      enabled: true

      annotations:
        cert-manager.io/cluster-issuer: selfsigned-cluster-issuer
        traefik.ingress.kubernetes.io/router.entrypoints: websecure
        traefik.ingress .kubernetes.io/router.tls: 'true'

      hosts:
        - prometheus.example.com

      paths:
        - /

      tls:
        - secretName: prometheus.example.com-secret
          hosts:
            - prometheus.example.com

    prometheusSpec:
      ruleSelectorNilUsesHelmValues: false
      serviceMonitorSelectorNilUsesHelmValues: false
      podMonitorSelectorNilUsesHelmValues: false
      probeSelectorNilUsesHelmValues: false

      resources:
        limits:
          cpu: 1
          memory: 2Gi
        requests:
          cpu: 200m
          memory: 2Gi

      storageSpec:
        volumeClaimTemplate:
          spec:
            storageClassName: 'dynamic-nfs'
            accessModes: ['ReadWriteOnce']
            resources:
              requests:
                storage: 50Gi
In case you don't know how to use Ingress with cert-manager and Traefik. Use the annotations traefik.ingress.kubernetes.io/router.entrypoints and traefik.ingress.kubernetes.io/router.tls to indicate the port used by Traefik.
The cfctl.yaml indicates that the entry-point websecure is port 443.
More about Traefik with Kubernetes Ingresses in their documentation.
Use the annotation cert-manager.io/cluster-issuer to indicate the certificate issuer and specify the generated certificate secret name in the tls[].secretName field. cert-manager will automatically search or generate the TLS certificates.
More about cert-manager in their documentation.
Notice that initChownData is not enabled. This is because our NFS server does not allow chown (change the owner of a directory) from a client.
This means that, for security reasons, our NFS server manages the permissions itself, i.e. :
chown 472:472 /srv/nfs/k8s/grafana
chown 1000:2000 /srv/nfs/k8s/prometheus
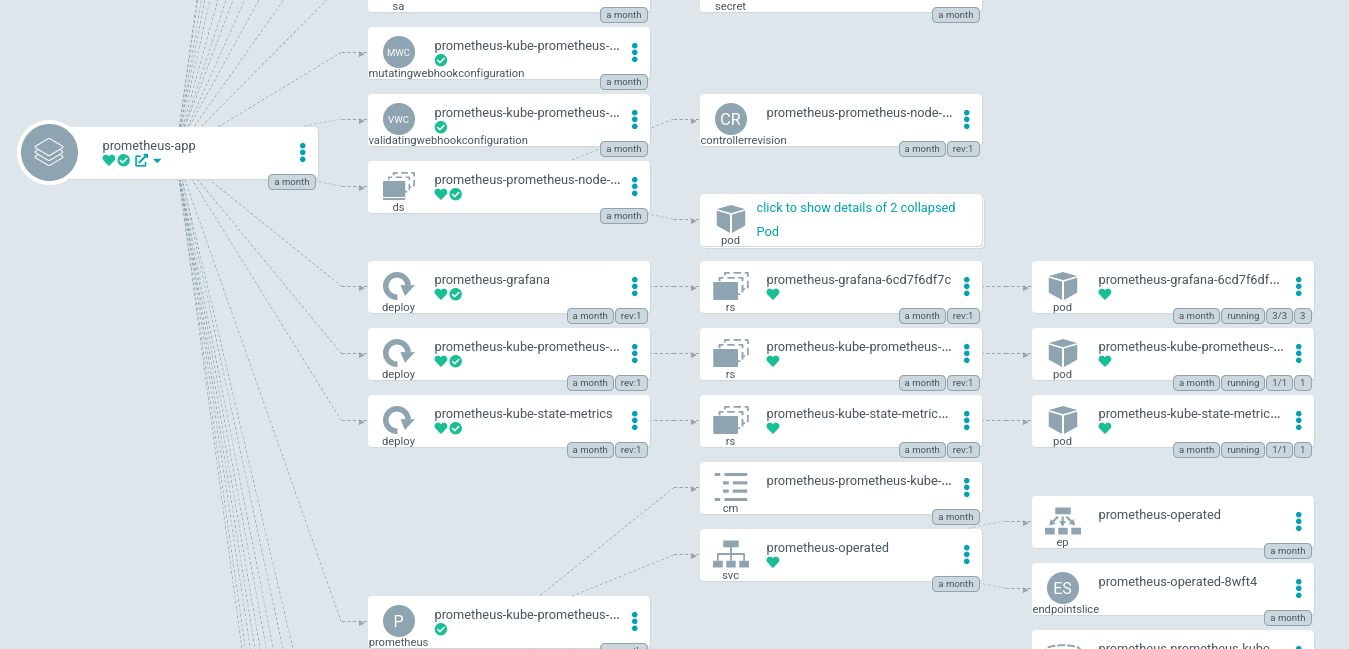
5. Deploy the app
Commit and push:
git add .
git commit -m "Added Prometheus stack application and values"
git push
And deploy:
kubectl apply -f argo/monitoring/apps/prometheus-crd-app.yaml
kubectl apply -f argo/monitoring/apps/prometheus-app.yaml